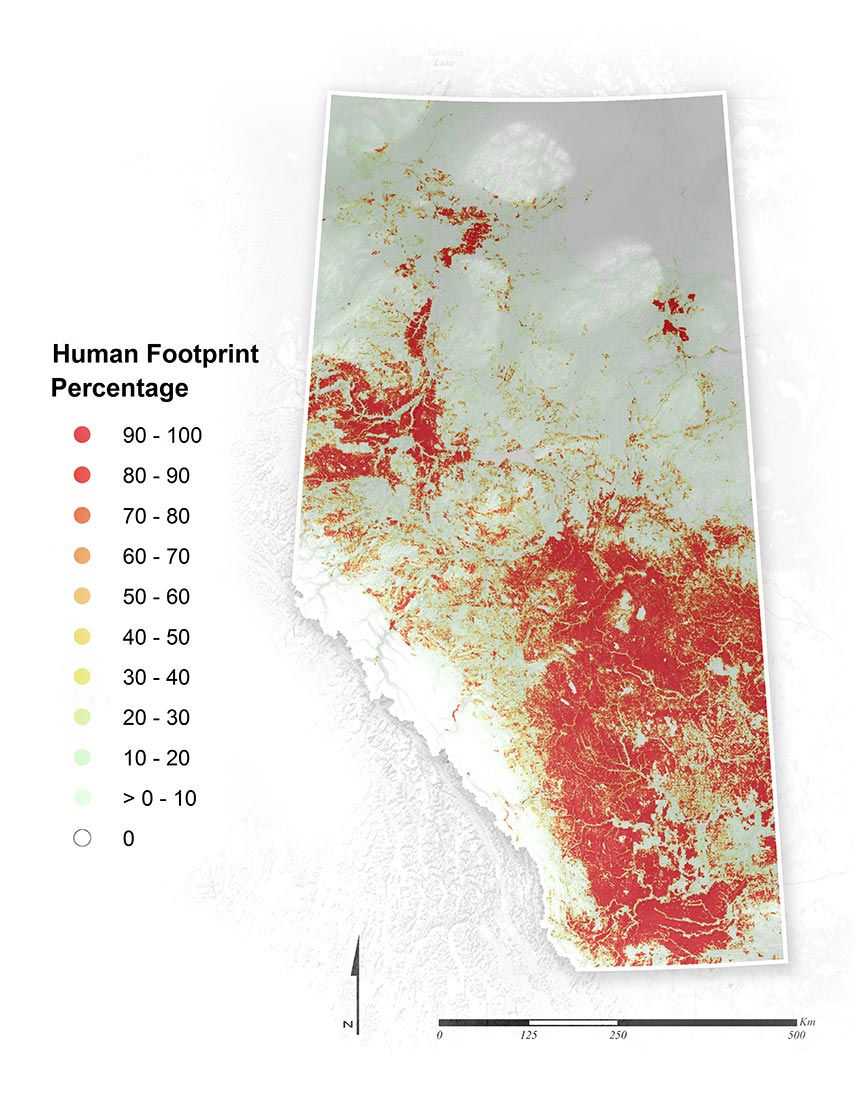
Browse through the status and trend of human footprint in Alberta (circa 2023) at the provincial scale, and broken down by administrative and ecological units.
Updated July, 2026
We transform natural landscapes for a variety of purposes—to grow food, to extract timber and fossil fuels, to make way for new housing developments, or to build road and rail systems to transport people and goods. The extent of human land use in any given area is collectively defined as human footprint[1,2]. Measuring human footprint information is increasingly being used as a land-use planning tool to monitor the status and change of landscapes[3].
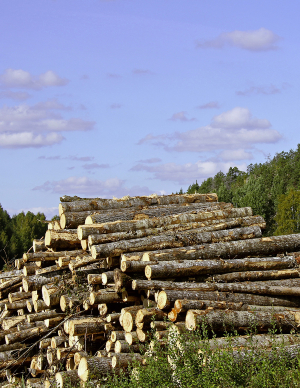
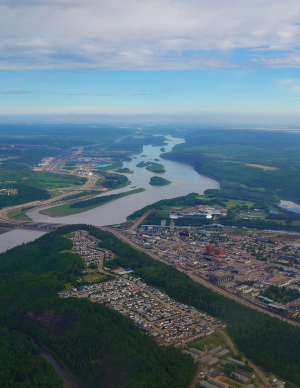
During the past century, the availability of natural resources in Alberta has defined human land use patterns, in both time and space. The province was considered a farming frontier in the late 1800s, and most of Alberta’s human footprint in the central and southern parts of the province is the result of this farming legacy. While agriculture remains important, other human land uses, particularly forestry and oil and gas development, have expanded in recent decades into previously undisturbed areas in the Foothills and Boreal Forest Natural Regions. To meet Alberta’s growing population needs, urban areas have expanded to keep up with industrial growth. As these activities continue, understanding and managing their cumulative effects on biodiversity are priorities in Alberta.
In this report, we summarize the status and trend of human footprint (circa 2023) as well as the density of linear features in Alberta. We provide an overview of human footprint at the provincial scale but also break down the information by natural region, Land-use Framework Planning Region, and Oil Sands Region. These results are updated annually.
The ABMI defines human footprint as the visible alteration or conversion of native ecosystems to temporary or permanent residential, recreational, agricultural, or industrial landscapes. The definition includes all areas under human use that have lost their natural cover for extended periods of time, such as cities, roads, agricultural fields, and surface mines. It also includes land that is periodically reset to earlier successional conditions by industrial activities such as forestry cutblocks and seismic lines.
The ABMI is continuously working to improve human footprint products. However, some human land uses, such as grazing, hunting, and trapping, or the effects of pollution, are not yet accounted for in our human footprint analyses. The classifications of roads are being reviewed province-wide based on newly available information, data provided by various subject matter experts, and the Government of Alberta. We are happy to announce that for the first time, in HFI 2023, the best available seismic line data has been integrated, updating classifications and year-of-origin, and width information from reference sources. Read more about these updates below, in the Seismic Snapshot[4], and HFI 2023 Metadata[5].
The ABMI monitors the status of Alberta’s human footprint using satellite imagery at two spatial scales:
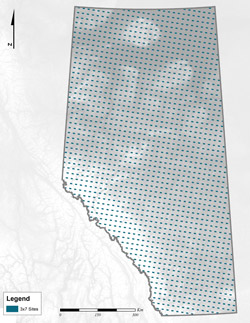
The ABMI uses human footprint data measured annually at a 1:5,000 scale to track changes in human footprint over time. Detailed annual samples of human footprint are measured in a 3×7-km rectangular area centred near each of the ABMI’s 1,656 sites, which when summed across all sites amounts to about 5% of the province’s land surface. ABMI human footprint trend data are available for 1950, 1985, 2000, 2001, and 2004 to 2023. Trend data and the metadata[5] associated with these data can be accessed here.
FIGURE: A detailed inventory of human footprint is created annually for a 3 × 7 km area located near each ABMI site.
At the provincial scale, the ABMI merges 20 human footprint sub-layers (based on 117 feature types) into a single integrated layer by applying a specific order of precedence to create the ABMI Human Footprint Inventory (HFI)[5]; to view the distribution of each of the sub-layers in Alberta, hover over each of the layers in the table below. This order of precedence determines how overlapping feature types are interpreted so that each location is assigned to a single integrated human footprint category. These 20 sub-layers are created by the ABMI and Government of Alberta as part of the Alberta Human Footprint Monitoring Program.
The year features originated is based on a series of satellite imagery sources as well as outside data sources provided by our partners.
Because overlapping feature types are removed during integration, the total area of the integrated HFI is smaller than the sum of its component sub-layers. Also note that due to rounding errors and/or small amounts of human footprint that cannot currently be assigned to a reporting category, the sum of the individual human footprint reporting categories may not equal the total human footprint value.
In this report, we use the HFI 2023 to:
HFI data and metadata are available in ABMI’s Open Data Portal[5].
TABLE: Order of precedence applied to human footprint sub-layers to create the ABMI HFI. Hover over a sub-layer to view its distribution.
| 1 | Reservoirs |
| 2 | Borrow Pits, Sumps, Dugouts, and Lagoons |
| 3 | Roads |
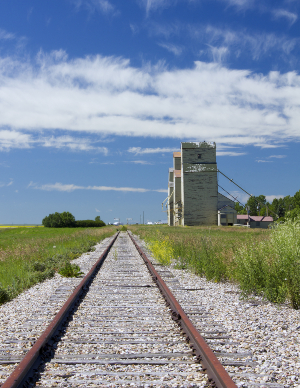
| 4 | Railways |
| 5 | Canals |
| 6 | Verges |
| 7 | Mine Sites |
| 8 | Industrial Sites |
| 9 | Well Sites Active |
| 10 | Landfills |
| 11 | Other Vegetated Surfaces |
| 12 | Wind Generation Facilities |
| 13 | Transmission Lines |
| 14 | Confined Feeding Operations (CFO) |
| 15 | Urban and Rural Residential |
| 16 | Well Sites Abandoned |
| 17 | Cultivation |
| 18 | Timber Harvest and Woody Vegetation Removal |
| 19 | Pipelines |
| 20 | Seismic Lines, Trails, and Other Linear Features |
As a successional footprint, forestry recovers with time after disturbance. To account for this recovery, we summarize “recovered forestry”—defined as "Forestry, Net" in this report—prorating the effects on biodiversity of older harvested areas using biotic recovery curves based on a literature review of the recovery of forest species in harvest areas of different ages[6,7].
A newly harvested area is considered to be 0% recovered, while a mature/old forest (80 years old) is 100% recovered. This is not to say that a recent harvest area has no biodiversity value, just that its biodiversity is as different from the original mature/old forest as it will ever be when it is first harvested. Field studies of the abundance of species in harvest areas of different ages were used to fill in the recovery curve between those two benchmarks.
Because results show faster recovery in deciduous forest than in conifer forest, we apply different recovery curves for these two forest types; see recovery values in Table below for coniferous and deciduous forest.
Age of forest harvest areas is based on age information assigned to each polygon during human footprint delineation. The Timber Harvest [YEAR] value is the best estimation of the year when the area was harvested. It has been determined by:
We have not yet incorporated information on the recovery of other types of human footprint into this report.
We report on the recovery of forestry footprint—i.e. the "Forestry, Net" area—by prorating the harvest area (including the Timber-Harvest-Green-Area and Timber-Harvest-White-Area sublayers) for how much it has recovered for biodiversity, based on its age and stand type (deciduous or conifer). For example, a 10-ha harvest area that is at an age where it is 36.8% recovered would have a "Forestry, Net" value of 6.32 ha (=10ha * (100-36.8%)). The idea is that the harvest area would have biodiversity equivalent to 6.32 ha of a recent, unrecovered clearcut plus 3.68 ha of mature forest.
To do the calculation, we use GIS to summarize the area of each harvest area, its age (years since harvest), and stand type (deciduous or conifer). We group the ages into classes of 0–9 yr, 10–19 yr, 20–39 yr, 40–59 yr, 60–79 yr, and 80+ yr. Based on the age class and stand type, we multiply the area of each harvest unit by the Effective Human Footprint Area (EHFA) factor in the table below, to get the Forestry, Net value of that unit.
The ABMI conducts ongoing research and development around footprint recovery.
Table: Footprint Recovery. Biodiversity recovery of deciduous and conifer stands by age class. EHFA = Effective Human Footprint Area.
| Stand Type | Age Class (yr) | Biodiversity Recovery (%) | EHFA Factor (%) |
| Deciduous | 0-9 | 0.0 | 100.0 |
| 10-19 | 36.8 | 63.2 | |
| 20-39 | 58.2 | 41.8 | |
| 40-59 | 83.1 | 16.9 | |
| 60-79 | 93.2 | 6.8 | |
| 80+ | 100.0 | 0.0 | |
| Coniferous | 0-9 | 0.0 | 100.0 |
| 10-19 | 8.0 | 92.0 | |
| 20-39 | 24.8 | 75.2 | |
| 40-59 | 64.7 | 35.3 | |
| 60-79 | 83.9 | 16.1 | |
| 80+ | 100.0 | 0.0 |
Wildfires are a natural disturbance process to which many Alberta ecosystems are adapted. When permanent human footprint such as industrial facilities burn, we expect them to be replaced by similar infrastructure and remain human footprint following wildfire. However, the effects of wildfire on the recovery of vegetated human footprint, such as harvest areas and seismic lines, remain an active area of research.
Currently, we do not have sufficient data to properly assess recovery of vegetated human disturbance post fire. Therefore, wildfire is not explicitly incorporated into human footprint recovery calculations. Seismic lines are therefore considered human footprint regardless of burn status. Forestry footprint remains classified as harvest footprint, but the recovery trajectory is reset to the year of the wildfire to reflect the restart of forest succession following the disturbance.
The status of human footprint was reported using summaries of human footprint categories from the HFI 2023.
The trend in human footprint for each area of interest was assessed using the 3 × 7-km detailed inventory of human footprint available from 1950, 1985, 2000, 2001, and 2004-2023. As we do not have provincial coverage of human footprint for all feature types for these intermediary years, we estimate a confidence interval for our estimates of trend. Confidence intervals are calculated as follows:
Trend data and the metadata associated with this can be accessed in ABMI’s Temporal Human Footprint page.
Status and trend are presented for total human footprint and the following seven reporting categories:
Agriculture Footprint
Areas of annual or perennial cultivation, including crops, tame pasture, confined feeding operations, and other high-density livestock areas. This category also includes peat mines—areas of surface disturbance mined for peat which is used in gardening.
Energy Footprint
(Mines, Wells, & Other Energy Features)
Forestry Footprint
Forestry, Net
The area of forestry footprint after accounting for biodiversity recovery through time based on harvest age and stand type (deciduous or conifer). See Measuring Recovery of Forestry Footprint (above) for additional details.
Transportation Footprint
Urban/Industrial Footprint
(Urban, Rural, & Industrial Features)
Residences, buildings, and disturbed vegetation and substrate associated with urban and rural settlements, such as housing, shopping centres, industrial areas, golf courses, and recreation areas, as well as bare ground cleared for industrial and commercial development. This category does not include industrial facilities associated with the oil and gas industry; these feature types are included in the Energy Footprint category.
![]()
Human-created Waterbodies
Waterbodies created for a variety of purposes, such as to extract fill (borrow-pits, water treatment), water livestock (dugouts), transport water (canals), meet municipal needs (water supply and sewage), and store water (reservoirs).
Linear disturbance is analyzed using polylines (lines centered on the width of the feature) and summarized as linear density, expressed as kilometres of linear footprint per square kilometre (km/km2). For seismic lines, only Legacy Seismic is currently included in linear density reporting. Other seismic line types are included in area-based human footprint calculations but are excluded from linear density results. Additional information on seismic line classifications, mapping completeness, reporting limitations, and recent classification updates is provided in the Seismic Line Classification Updates and Caveats section below (also see the Seismic Snapshot[4]).
Two versions of linear density calculations are reported for the polylines of each linear footprint sublayer:
Integrated density better represents the current extent (circa 2023) of linear disturbance on the landscape and is the metric used throughout the report. Some linear features occur within multiuse corridors where, for example, roads and pipelines are co-located. By accounting for these overlaps, integrated density provides a more representative measure of unique linear disturbance. Total density calculations are available in the table view accompanying the linear density results.
Linear density is presented for all linear feature reporting categories combined, and by six linear feature categories:
Legacy Seismic Lines
Other Linear Features
Includes recreational trails from the Crown Land Trails dataset published by Alberta Environment and Protected areas (current as of April 15, 2024). This category also includes linear features that are not managed as recreational trails under the Crown Land Trails dataset and that are not verified by other reference datasets, as well as Alberta Township Survey (ATS) grid lines. It excludes seismic lines and vegetated roads which are included in other reporting categories.
Pipelines Corridors
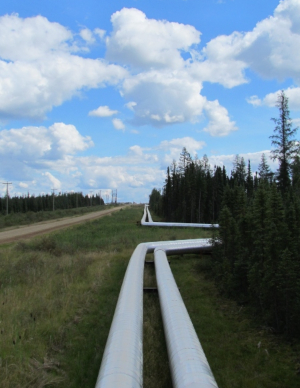
A line of underground and overground high-pressure pipes, used for the delivery of fluids such as petrochemicals, as well as the physical clearing around the pipelines.
Roads
Transmission Lines
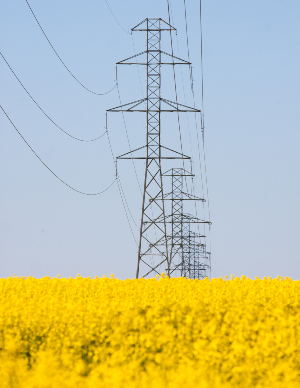
Utility corridor greater than 10 m wide with poles, towers, and lines for transmitting high voltage (>69 kV) electricity.
Railway
Corridors created for railways, as well as the physical clearing around the railway.